Press & media
Landfall tracks whether the Strait of Hormuz disruption is escalating, and whether it’s actually reaching markets. If you’re covering the crisis, everything here is free to use in your reporting with credit. The data updates every 15 minutes, the methodology is fully published, and there’s a stable daily record you can cite.
The one number worth quoting
Landfall’s core read is the divergence: the gap between the physical situation (satellite-tracked ship transits, GPS jamming, official incident warnings) and what markets are pricing (oil, financial stress, pump prices). It answers the question a headline can’t: is anyone actually reacting? The current read is always on the live dashboard and charted across the crisis, with the data free to download, on the divergence page.
Ready-to-use assets
The live divergence card, auto-updated every 15 minutes, always current. Hotlink it or download it; it renders at 1200×630:
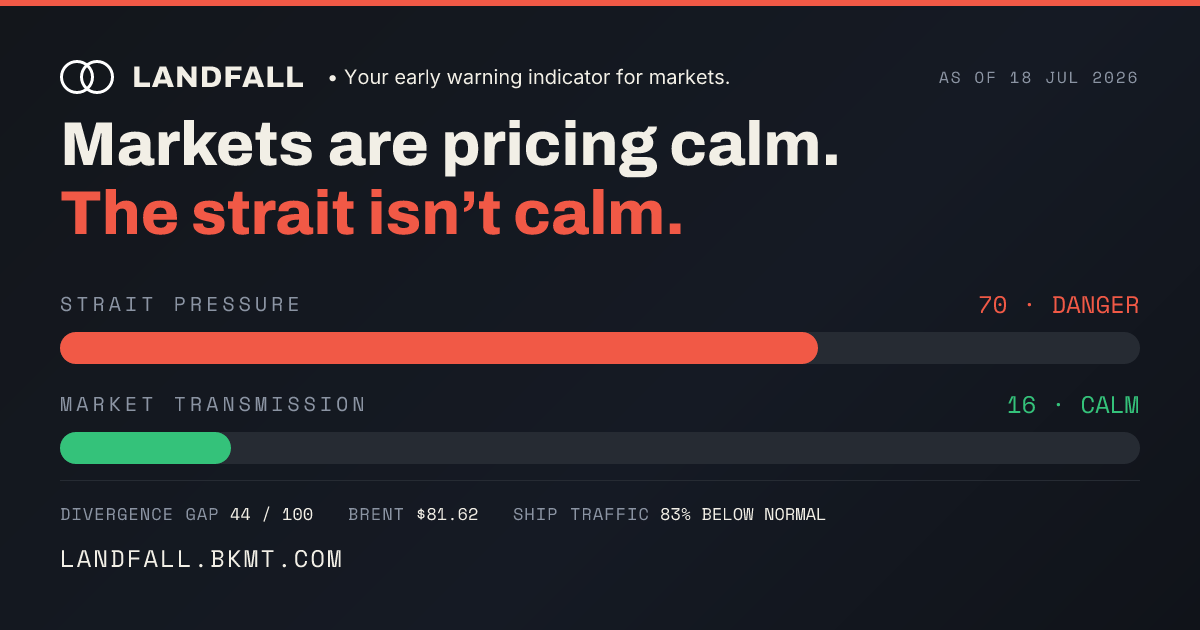
- Live card (always current): landfall.bkmt.com/og/today.png
- Daily records (stable, citable): each day has a permalink page and matching image, landfall.bkmt.com/d/YYYY-MM-DD and /og/YYYY-MM-DD.png. A citation to a dated page won’t drift after the situation changes.
- Logo: landfall.bkmt.com/icon.png (512×512).

Embed the live status badge
Running a blog, newsletter, or dashboard? Drop in the live badge, it always shows the current Chokepoint Pressure and Market Fragility read, updates on its own, and links back to Landfall. It’s a plain image, so it works anywhere an image does (including READMEs and most CMSs):
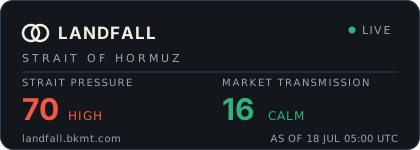
<a href="https://landfall.bkmt.com/"><img src="https://landfall.bkmt.com/badge.svg" alt="Strait of Hormuz status, Landfall" width="420" height="150"></a>[](https://landfall.bkmt.com/)https://landfall.bkmt.com/badge.svgThe badge is descriptive, it reports the current read, not a recommendation. Please keep the link to Landfall intact.
Machine-readable data (free with credit)
If you’d rather pull the numbers than screenshot them, two feeds are open and free, same license as everything else, just credit Landfall:
- Live JSON: landfall.ikowilson.workers.dev/snapshot, the full current reading (both gauges, every indicator, the divergence, source health), refreshed every 15 minutes. CORS-open, so it works straight from a browser, notebook, or dashboard.
- Historical series (CSV / JSON): /history.csv and /history, the full daily time-series of the divergence gap and both gauges, back to the pre-crisis baseline. The divergence page charts it.
- RSS feed: landfall.bkmt.com/feed.xml, the daily divergence record, newest first, for feed readers and newsletters. Each entry links to a stable /d/YYYY-MM-DD permalink.
The data is descriptive, not a forecast, and comes with no uptime guarantee, but it’s the same feed the site itself runs on. If you need a specific slice or a historical pull for a story, just ask.
Reuse license
Charts, cards, and derived figures from Landfall are free to republish, in articles, newsletters, broadcasts, and videos, commercial or not, under one condition: visible credit to “Landfall (landfall.bkmt.com)”, with a link where the medium allows. Please don’t imply Landfall endorses your conclusions, and don’t present its readings as financial advice or forecasts, the tool is deliberately descriptive (a lighthouse, not an oracle).
What you can rely on (and what to know)
The gauges are built from hard public data: IMF PortWatch satellite transit counts, EIA oil and inventory data, Federal Reserve (FRED) macro series, GPSJam interference data, and UKMTO incident warnings, every source and its health is shown on the sources page, and the full scoring method is public on the methodology page.
One honesty note we’d rather you hear from us: the moving ship dots on the map are an illustration scaled to the real transit count (no free source reliably tracks individual Gulf vessels, so we don’t fake it, and we label it). Cite the transit numbers, the gauges, and the divergence, they’re real. The dots are decoration.
Boilerplate
Landfall (landfall.bkmt.com) is a free, independent dashboard tracking whether the Strait of Hormuz disruption is escalating and whether it is reaching markets. It blends satellite ship-tracking, GPS-interference data, official incident warnings, and market indicators into two plain-language gauges, updated every 15 minutes, with a fully published methodology. Landfall is built by LJK Creative LLC, carries no ads, and provides no financial advice.
Media contact
Questions, interview requests, custom charts, or a data pull for a story, use the contact form. Custom views for a specific angle can usually be turned around fast.